
Mathematics & Probability
Section 1
Core Idea
Mean, median, and mode are three ways to summarize the "center" of a dataset — and they tell different stories. The mean (average) includes every value, making it sensitive to extremes. The median (middle value) resists outliers, showing where the typical case actually sits. The mode (most frequent value) reveals the most common outcome. In symmetrical distributions they converge; in skewed ones they diverge dramatically. A startup's "average revenue per customer" can be pulled up by one whale account, masking that the median customer pays far less. Choosing which measure to report — and which to examine — is never neutral. The model teaches that every summary statistic is a compression, and the choice of compression determines what reality you see.
Free playbook
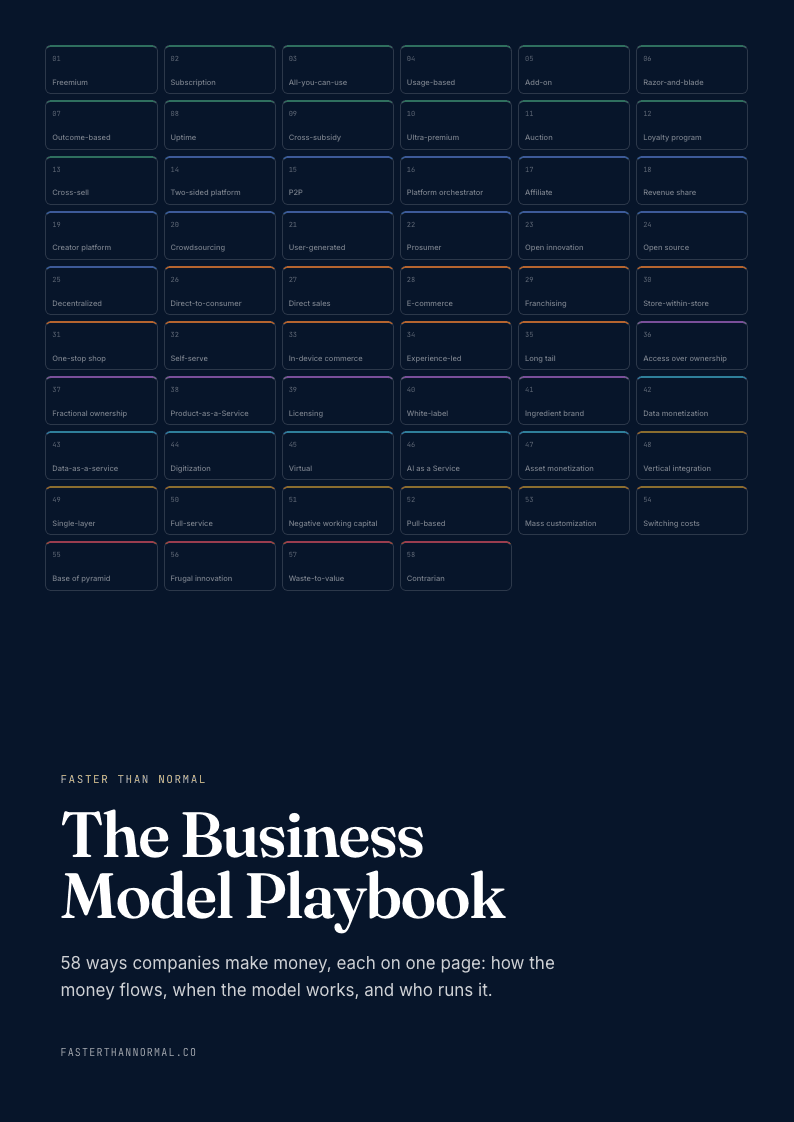
Get The Business Model Playbook
58 business models, one visual page each: how the money flows, the metrics that matter, and who runs it. Free when you join the Faster Than Normal email.
Free. No spam. Unsubscribe anytime.
Section 2
How to See It
Sales
You're seeing it when your average deal size looks impressive at $120K, but the median is $18K — a handful of enterprise contracts are inflating the mean while most deals are small.
People
You're seeing it when "average employee tenure" is reported as five years, but the mode is eleven months. Most people leave quickly; a few long-tenured staff pull the average up.
Product
You're seeing it when average session time is 12 minutes, but the median is 2 minutes. A small cohort of power users is creating a misleading average that doesn't represent the typical experience.
Section 3
How to Use It
Report multiple measures of center for any metric that matters. When data is skewed — revenue, usage, deal size — lead with the median and show the distribution. Use the gap between mean and median as a diagnostic: a large gap signals skew and warns that averages are misleading. Use the mode to understand the most common experience your customers or employees actually have.
Decision filter
"Are we looking at the mean, and could the median or mode tell a different story?"
As a founder
Default to median for customer metrics — it represents the typical user, not the one distorted by outliers. Report the mean only alongside the distribution or with outlier context. When the mean-median gap is large, investigate the skew before making resource decisions based on the average.
Section 5
Founders & Leaders
Reed HastingsCo-founder & former CEO, Netflix
Hastings built Netflix's recommendation engine and content strategy on distributional thinking, not averages. The insight that powered Netflix's content library wasn't average viewer preference — it was understanding the modes of distinct taste clusters and the long tail of niche demand. A show that appeals "on average" to everyone may engage no one deeply. Hastings invested in titles that were the mode for specific audience segments, even if they dragged down the mean appeal score across all users. Founders can apply the same logic: optimize for the typical customer (median) and the most common behavior (mode), not the average that blends distinct populations into a single misleading number.
Section 7
Connected Models
Reinforces
Power Law Distribution
In power-law distributions, the mean is pulled far from the median by extreme values. Understanding mean-median-mode divergence is essential to recognizing when you're in a power-law environment.
Reinforces
Outliers
Outliers distort the mean while leaving the median and mode largely intact. Understanding which central measure to use depends on understanding the role of outliers in your data.
Tension
Simpson's Paradox
Simpson's Paradox shows that aggregate statistics can reverse when data is segmented. Mean-median-mode analysis at the aggregate level can mask opposite patterns within subgroups.
Section 8
One Key Quote
— Aaron Levenstein"Statistics are like bikinis. What they reveal is suggestive, but what they conceal is vital."
Section 11
Summary & Further Reading
Mean, median, and mode are three compressions of the same data that tell different stories. Lead with the median for skewed data, use the mode to understand the most common experience, and treat a large mean-median gap as a signal that your summary is hiding the real picture.
01
Book
Accessible introduction to statistical concepts including measures of central tendency.
02
Book
Mathematical reasoning for everyday decisions, including when averages mislead.
03
Book
The Netflix origin story and its data-driven approach to content and customer understanding.