
Mathematics & Probability
Section 1
Core Idea
Anscombe's Quartet is a set of four datasets that share nearly identical summary statistics — same mean, variance, correlation, and regression line — yet look completely different when graphed. It demonstrates a critical principle: summary statistics can conceal the structure of your data. Two datasets can have the same average and the same trendline while one is linear, one is curved, one is driven by a single outlier, and one has no real relationship at all. The lesson for decision-makers is that relying on metrics without visualizing the underlying data is a reliable path to wrong conclusions.
Free playbook
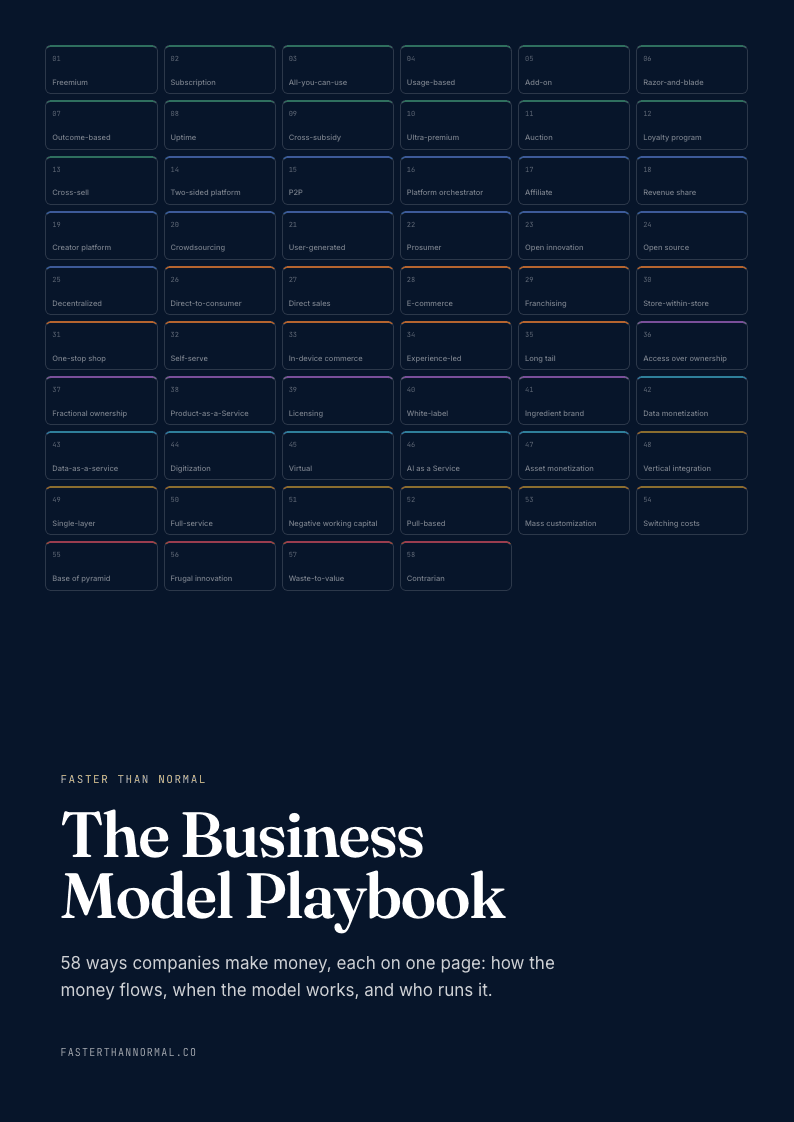
Get The Business Model Playbook
58 business models, one visual page each: how the money flows, the metrics that matter, and who runs it. Free when you join the Faster Than Normal email.
Free. No spam. Unsubscribe anytime.
Section 2
How to See It
Analytics
You're seeing it when two product cohorts show the same average retention rate, but one has steady engagement while the other has a small group of power users masking mass churn.
Finance
You're seeing it when two investment portfolios show the same average return, but one is stable and the other is volatile with a single outsized gain pulling the average up.
Operations
You're seeing it when two factories report the same average defect rate, but one has consistent quality while the other alternates between perfect batches and disaster batches.
Section 3
How to Use It
Never trust a summary metric without seeing the distribution behind it. When presented with averages, correlations, or trendlines, ask to see the scatter plot. Look for outliers, clusters, nonlinear patterns, and bimodal distributions that a single number would hide. Build a habit of visualizing before deciding — especially when the stakes are high and the data feels tidy.
Decision filter
"Am I seeing the actual distribution of this data — or am I trusting a summary statistic that could be hiding something critical?"
As a founder
When your team presents metrics — average deal size, mean time-to-close, NPS scores — demand the distribution. Averages can mask bimodal realities where your business is serving two fundamentally different segments. The strategic response to each is different.
Section 5
Founders & Leaders
Jim SimonsFounder of Renaissance Technologies; mathematician
Simons built the most successful quantitative fund in history by insisting that models be validated against the actual structure of data, not just summary statistics. Renaissance Technologies' edge came from detecting subtle patterns that standard statistical summaries — means, correlations, regressions — would miss entirely. Simons understood Anscombe's Quartet intuitively: the same summary can describe radically different realities. For founders relying on data for decisions, the lesson is that aggregated metrics are starting points, not conclusions. Always look at the shape of the data before acting on the number.
Section 7
Connected Models
Warns-against
Signal vs Noise
Signal vs noise is about separating meaningful patterns from randomness. Anscombe's Quartet shows that summary statistics can present noise as signal — making the meaningless look meaningful without visual inspection.
Challenges
Regression Analysis
Regression analysis fits a line to data. Anscombe's Quartet demonstrates that a regression line can look identical for wildly different datasets — the line alone is insufficient without examining residuals and distribution.
Warns-against
Data Dredging
Data dredging finds spurious patterns in data by over-relying on statistical tests. Anscombe's Quartet reminds us that statistical summaries can confirm relationships that don't actually exist in the data's structure.
Section 8
One Key Quote
— Francis Anscombe"A computer should make both calculations and graphs. Both sorts of output should be studied; each will contribute to understanding."
Section 11
Summary & Further Reading
Anscombe's Quartet proves that identical summary statistics can describe completely different data structures. Always visualize the distribution before trusting the number. Metrics without graphs are guesses wearing a suit.
01
Book
The definitive work on data visualization and why graphs reveal what statistics conceal.
02
Book
On Jim Simons, Renaissance Technologies, and the rigorous data analysis that produced extraordinary returns.
03
Book
On how summary statistics mislead, manipulate, and obscure the truth in data.