
Contents
A business model in which a platform or distributor shares a defined percentage of the revenue it generates with the partners, creators, or suppliers who contribute value — aligning incentives so that both sides profit only when the end customer pays. The platform trades margin for ecosystem growth, betting that a smaller slice of a much larger pie will outperform full ownership of a smaller one.
Also called: Rev-share, Profit-sharing, Partner economics
Section 1
How It Works
Revenue share is an economic arrangement, not a product architecture. A platform, distributor, or aggregator generates revenue — through sales, advertising, subscriptions, or transactions — and then splits that revenue with the partners who helped create the value. The split is typically codified as a fixed percentage (e.g., 70/30), though some models use tiered or dynamic rates that shift based on volume, exclusivity, or strategic priority.
The critical insight is that revenue share converts fixed costs into variable costs and transforms suppliers into co-investors. Instead of paying creators, developers, or partners upfront — bearing the risk that their contribution won't generate returns — the platform pays only when revenue materializes. This dramatically lowers the platform's capital requirements while giving partners unlimited upside. The partner accepts lower guaranteed income in exchange for the possibility of outsized returns, and the platform accepts lower per-unit margins in exchange for an exponentially larger supply base.
SupplyPartners / CreatorsDevelopers, artists, publishers, affiliates
Contributes content, product, or traffic→
PlatformRevenue EngineDistribution, monetization, analytics, payments
Delivers audience, customers, or transactions→
DemandEnd CustomersConsumers, advertisers, subscribers
↑Revenue split between platform and partner (typically 30/70 to 55/45)
Monetization varies by context. Apple takes 30% of App Store purchases and passes 70% to developers (dropping to 15% for small developers earning under $1M annually). YouTube shares approximately 55% of ad revenue with creators through its Partner Program. Spotify distributes roughly 70% of its subscription and ad revenue to rights holders — labels, publishers, and distributors — retaining approximately 30%. Affiliate programs like Amazon Associates pay 1–10% of referred sales depending on product category, keeping the rest.
The central tension in every revenue-share model is the split itself. Set it too aggressively in the platform's favor and you starve the supply side — creators leave, developers build elsewhere, partners defect to competitors. Set it too generously and you can't fund the infrastructure, marketing, and R&D that makes the platform worth building on in the first place. The split is not a financial detail; it is the single most important strategic decision in the model, because it determines who shows up, how hard they work, and how long they stay.
Section 2
When It Makes Sense
Revenue share is not universally applicable. It works best when the platform needs external contributors to generate value at a scale it could never achieve alone — and when those contributors need the platform's distribution, monetization infrastructure, or audience more than they need guaranteed payment.
✓
Conditions for Revenue Share Success
| Condition | Why it matters |
|---|---|
| Massive potential supply base | The platform needs thousands or millions of contributors — too many to pay upfront. Revenue share scales where fixed payments don't. YouTube has over 4 million monetized channels; no payroll could support that. |
| Platform controls distribution | Partners accept a revenue split because the platform delivers an audience they can't reach alone. If partners can distribute independently at comparable scale, the platform has no leverage to justify its cut. |
| Revenue is measurable and attributable | You can only share what you can track. The model requires precise attribution — which partner's content generated which revenue. Digital platforms excel here; physical businesses struggle. |
| Variable quality of contributions | When some partners generate 1,000x more value than others, revenue share automatically rewards the best and starves the worst. It's a self-sorting mechanism that eliminates the need for the platform to pick winners. |
| High upfront uncertainty | When neither side knows which content, app, or product will succeed, revenue share distributes risk fairly. The platform doesn't overpay for flops; the partner doesn't undersell hits. |
| Network effects from supply diversity | More partners → more content/products → more customers → more revenue → more partners. Revenue share fuels this flywheel by making participation nearly free for new entrants. |
| Low marginal cost of distribution | The platform's cost to distribute the 10,000th app or video should be negligible. If each additional partner requires significant operational overhead, the economics collapse. |
The underlying logic is alignment through shared outcomes. When a platform pays partners a fixed fee, the partner's incentive is to minimize effort after the check clears. When a platform shares revenue, the partner's incentive is to maximize the value they create — because they eat what they kill. This alignment is the model's deepest advantage, and it's why revenue share tends to produce larger, more vibrant ecosystems than any alternative compensation structure.
Section 3
When It Breaks Down
Revenue share looks elegant in theory. In practice, it creates structural tensions that can tear ecosystems apart — especially as the power dynamic between platform and partner shifts over time.
⚠
Failure Modes
| Failure mode | What happens | Example |
|---|---|---|
| Platform squeeze | The platform unilaterally changes the split or the rules after partners have invested heavily. Partners feel trapped — too dependent to leave, too exploited to thrive. | Epic Games sued Apple in 2020 over the 30% App Store commission, arguing it was monopolistic after years of ecosystem lock-in. |
| Winner-take-all concentration | Revenue share rewards the top 1% of partners disproportionately. The long tail earns almost nothing, becomes disillusioned, and stops contributing — hollowing out the ecosystem's diversity. | Spotify's per-stream model reportedly pays top artists well but yields fractions of a cent for independent musicians. The top 1% of artists capture the vast majority of royalty payouts. |
| Attribution gaming | Partners manipulate metrics to inflate their share — fake clicks, bot views, manufactured engagement. The platform spends increasing resources on fraud detection instead of value creation. | YouTube's "adpocalypse" events, where advertisers pulled spend after discovering ads running alongside fraudulent or harmful content. |
| Race to the bottom | When the split is tied to volume, partners optimize for quantity over quality. The ecosystem floods with low-value content or products, degrading the customer experience. | The App Store's early years saw a flood of copycat and spam apps designed to game download metrics. |
| Disintermediation by top partners | The most valuable partners — the ones generating the most revenue — have the most incentive and ability to bypass the platform entirely, taking their audience direct. | Major podcasters leaving ad-supported platforms for direct subscription models (e.g., Joe Rogan's exclusive Spotify deal was partly about Spotify preventing this). |
| Regulatory reclassification | Governments decide that revenue-share partners are actually employees or that the platform's cut constitutes an anticompetitive tax, forcing structural changes to the model. | EU Digital Markets Act (2024) requiring Apple to allow alternative app stores and payment systems, directly threatening the 30% commission model. |
The most dangerous failure mode is platform squeeze — not because it kills the ecosystem immediately, but because it poisons trust slowly. When Apple launched the App Store in 2008, the 70/30 split was generous compared to retail distribution. By 2020, with the App Store generating an estimated $80+ billion in annual billings, that same 30% felt extractive to developers who had built their businesses on the platform. The split didn't change; the power dynamic did. Revenue-share models must evolve their terms as the ecosystem matures, or they will face revolt — in courtrooms, in legislatures, or in the market.
Section 4
Key Metrics & Unit Economics
Revenue-share models require a distinct set of metrics because the platform's revenue is a derivative of its partners' success. You're not just measuring your own performance — you're measuring the health of an entire ecosystem.
Gross Revenue
Total revenue generated before partner payouts
The top line before the split. This is the total economic value the platform facilitates. For Apple's App Store, this is estimated at $80–90B annually in gross billings. For YouTube, it's total ad revenue generated against partner content.
Net Revenue (Platform Share)
Gross Revenue × Platform's Share %
What the platform actually keeps. Apple retains ~30% (or 15% for small developers). YouTube retains ~45% of ad revenue on partner content. This is the true top line for the platform's P&L.
Partner Payout Ratio
Total Partner Payouts ÷ Gross Revenue
The inverse of take rate. Spotify pays out ~70% of revenue to rights holders. A declining payout ratio signals platform squeeze; a rising one signals competitive pressure or regulatory concession.
Revenue Per Partner (RPP)
Gross Revenue ÷ Active Partners
Measures ecosystem concentration. If RPP is high but driven by a few mega-partners, the platform is fragile. Healthy ecosystems show rising RPP across a broad base.
Partner Retention Rate
% of revenue-generating partners active after 12 months
The leading indicator of ecosystem health. If partners are churning, the revenue share isn't working — either the split is wrong, the distribution is insufficient, or the tools are inadequate.
Ecosystem Gini Coefficient
Measure of revenue concentration across partners (0 = equal, 1 = one partner gets all)
A high Gini coefficient (above 0.8) means extreme concentration — a few partners capture nearly all the revenue. This creates dependency risk for the platform and disillusionment for the long tail.
Core Revenue Formula
Platform Revenue = Σ (Partner_i Revenue × Platform Share %)
Partner_i Revenue = Partner_i Audience × Monetization Rate × Conversion Rate
Ecosystem Value = Platform Revenue + Total Partner Payouts + Consumer Surplus
The key lever most platforms underinvest in is partner monetization rate — helping partners earn more, not just taking a bigger cut. When YouTube improved its ad-matching algorithms, total ad revenue grew, and both YouTube and creators benefited. When Apple introduced Search Ads in the App Store, it created a new revenue stream that didn't require changing the commission split. The best revenue-share platforms act as revenue multipliers for their partners, not just revenue extractors.
Section 5
Competitive Dynamics
The primary source of competitive advantage in a revenue-share model is ecosystem lock-in through accumulated network effects and switching costs. A developer who has built their business on the App Store — with years of reviews, ratings, download history, and integration with Apple's APIs — faces enormous switching costs. A YouTube creator with 2 million subscribers and thousands of hours of content optimized for YouTube's algorithm can't easily replicate that on a competing platform. The revenue share itself isn't the moat; the ecosystem built around it is.
Revenue-share models tend toward oligopoly rather than monopoly. The reason is that different platforms can offer different value propositions to the same partner base. A mobile developer might publish on both the App Store and Google Play, accepting both platforms' revenue splits, because each delivers a distinct audience. A musician distributes through Spotify, Apple Music, and YouTube Music simultaneously. Multi-homing is the norm, not the exception — which means no single platform achieves true winner-take-all dynamics.
The competitive response to an entrenched revenue-share platform typically takes one of three forms. First, split competition: a challenger offers a more favorable split to lure partners (Epic Games Store launched with an 88/12 split versus Steam's 70/30). Second, vertical integration: a major partner decides to become its own platform (Netflix transitioned from licensing content to producing its own, eliminating the revenue-share relationship with studios). Third, regulatory intervention: governments force the platform to lower its take or open its ecosystem (the EU's Digital Markets Act targeting Apple and Google).
Over time, the strongest revenue-share platforms deepen their moats by becoming infrastructure that partners can't replicate. Apple provides not just distribution but payment processing, fraud prevention, device integration, and developer tools. YouTube provides not just an audience but an ad sales force, content ID systems, analytics, and a recommendation engine that drives 70%+ of watch time. The more infrastructure the platform provides, the more the revenue split feels justified — and the harder it is for partners to leave.
Section 6
Industry Variations
Revenue share manifests across nearly every digital industry, but the split ratios, power dynamics, and strategic implications vary dramatically by sector.
◎
Revenue Share Variations by Industry
| Industry | Typical split (platform / partner) | Key dynamics |
|---|---|---|
| App stores | 30/70 (15/85 for small devs) | Duopoly (Apple + Google) with near-total distribution control. Regulatory pressure forcing alternative payment options. The 30% rate has become an industry lightning rod. |
| Music streaming | ~30/70 | Rights holders (labels) capture most of the 70%. Individual artists see a fraction. Pro-rata pooling means top artists subsidize the platform's economics. Per-stream rates reportedly $0.003–$0.005. |
| Video / creator platforms | 45/55 (YouTube AdSense) | Ad revenue is the primary pool. Creators increasingly diversify into sponsorships, merch, and memberships that bypass the platform's share. YouTube responded by adding channel memberships and Super Chat. |
| Affiliate marketing | 90–99/1–10 | The "platform" (retailer) keeps the vast majority. Affiliates earn 1–10% commissions on referred sales. Amazon Associates reportedly pays 1–4% on most categories. Volume is the only path to meaningful income. |
| Gaming | 30/70 (Steam) to 12/88 (Epic) | The most actively contested split in tech. Steam's 30% was unchallenged for a decade until Epic launched its store in 2018 with 12%. Valve responded with tiered rates (dropping to 20% above $50M in sales). |
| E-commerce marketplaces | Variable (Etsy: ~21% all-in) | Blends transaction fees, listing fees, payment processing, and optional advertising. The "revenue share" is implicit — sellers pay a composite rate that functions as a split. Transparency varies widely. |
The pattern across industries is clear: the platform's share correlates with its distribution monopoly power. Where distribution is exclusive (app stores on locked devices), the platform commands 30%. Where distribution is contestable (gaming stores on open PCs), competition drives the split toward the partner. Where the partner has independent reach (major music labels, top YouTubers), the platform's leverage erodes regardless of the formal split.
Section 7
Transition Patterns
Revenue share rarely emerges as a company's first business model. It typically evolves from simpler arrangements as the platform gains scale and needs to attract a broader partner base.
Evolves fromLicensingDirect sales / Network salesAffiliate / Referral
→
Current modelRevenue Share
→
Evolves intoPlatform orchestrator / AggregatorCreator platformSwitching costs / Ecosystem lock-in
Coming from: Many revenue-share models begin as licensing arrangements. Early software distribution involved one-time license fees paid to developers; Apple's App Store transformed this into an ongoing revenue share on every transaction. Amazon started as a direct retailer before opening its marketplace and sharing revenue with third-party sellers (who now account for over 60% of Amazon's unit sales). Affiliate programs evolved from simple referral fees into sophisticated revenue-share ecosystems with real-time tracking and tiered commissions.
Going to: Mature revenue-share platforms tend to evolve in two directions. Some become full platform orchestrators — adding so many layers of infrastructure (payments, analytics, logistics, advertising, financing) that the revenue share becomes just one of multiple monetization streams. Amazon's marketplace revenue share is now dwarfed by its advertising and fulfillment services revenue. Others evolve into ecosystem lock-in models where the accumulated switching costs — not the split itself — become the primary retention mechanism. Apple's developer ecosystem is locked in by APIs, frameworks, device integration, and customer expectations, not by the attractiveness of the 70/30 split.
Adjacent models: Licensing (fixed fee instead of variable share), Affiliate / Referral (one-directional commission rather than ongoing split), Creator platform (revenue share specifically structured around individual creators rather than institutional partners), and Freemium (where the platform monetizes directly and shares nothing, but offers free distribution as the value exchange).
Section 8
Company Examples
Y(
YouTube (Google)
Creators ↔ Advertisers · Partner share: ~55% of ad revenue
YouTube's Partner Program, launched in 2007, transformed online video from a cost center into a career path. By sharing 55% of ad revenue with creators, YouTube attracted a supply base no competitor could match — over 4 million monetized channels by 2024. The strategic brilliance was recognizing that paying creators variable compensation based on viewership would produce a self-reinforcing quality flywheel: better content → more viewers → more ad revenue → more creator investment. YouTube reportedly paid creators over $70 billion cumulatively through 2024. The model's weakness is its dependence on advertising — when brands pull spend (as during multiple "adpocalypse" events), creators bear the downside alongside the platform.

Apple
App Store · Platform share: 30% (15% for developers earning < $1M/year)
Apple's 70/30 split, introduced with the App Store in 2008, became the de facto standard for digital distribution. The split was initially celebrated — physical retail took 50–70% of software revenue — but as the App Store grew to an estimated $80–90 billion in annual gross billings, the 30% commission became the most contested fee in technology. Apple's Small Business Program (2021), reducing the commission to 15% for developers earning under $1 million, was a strategic concession to regulatory pressure and the Epic Games lawsuit. The model's enduring power comes not from the split's fairness but from the fact that there is no alternative way to reach 1.5 billion active Apple devices.
S
Spotify
Artists/Labels ↔ Listeners · ~70% of revenue to rights holders
Spotify distributes approximately 70% of its total revenue to rights holders — primarily major labels (Universal, Sony, Warner) and publishers. In 2023, Spotify reported paying over €9 billion in royalties. The complexity lies in the allocation: Spotify uses a pro-rata model where each subscriber's payment is distributed based on total platform listening share, not individual listening habits. This means a subscriber who listens exclusively to indie folk is effectively subsidizing Drake's royalty payments. The model has drawn persistent criticism from independent artists, who argue that per-stream rates (reportedly $0.003–$0.005) are unsustainable. Spotify's challenge is that its revenue-share partners — the major labels — are also its most powerful negotiating counterparties.
E
Etsy
Sellers ↔ Buyers · Composite take rate: ~21% (transaction fee + processing + ads)
Etsy's revenue share is layered rather than simple. Sellers pay a $0.20 listing fee, a 6.5% transaction fee, and payment processing fees of approximately 3% + $0.25. On top of this, Etsy Ads (an optional but increasingly necessary tool for visibility) adds another variable cost. The composite effective take rate has risen from roughly 15% in 2018 to approximately 21% by 2023 — a gradual squeeze that has generated seller backlash, including organized strikes. Etsy's case illustrates how revenue-share models can drift toward extraction when the platform controls discovery and the partner base is fragmented.

Amazon
Associates Program · Affiliate commissions: 1–10% by category
Amazon Associates, launched in 1996, is one of the oldest and most influential revenue-share programs in digital commerce. Affiliates earn 1–10% of qualifying purchases made through their referral links (with most physical product categories paying 1–4%). The program reportedly has over 900,000 active affiliates globally. Amazon's genius was recognizing that paying a small percentage of revenue to thousands of niche content creators — bloggers, review sites, comparison tools — was far more cost-effective than traditional advertising. The model's vulnerability: Amazon has repeatedly cut commission rates (most recently in 2020, slashing rates in several categories by 50% or more), and affiliates have no recourse because they have no contractual leverage.
Section 9
Analyst's Take
Faster Than Normal — Editorial View
Revenue share is the business model equivalent of a social contract. And like all social contracts, it works beautifully when both parties feel they're getting a fair deal — and collapses when one side realizes the other has all the power.
Here's what most people get wrong about revenue share: they treat the split as a financial decision when it's actually a governance decision. The percentage you choose doesn't just determine how much money each side makes. It determines who shows up to your ecosystem, how hard they work, how loyal they are, and whether they'll still be there in five years. Apple's 30% isn't a pricing strategy. It's a constitutional framework for the App Store economy. And like any constitution, it needs to evolve as the population it governs matures and gains power.
The key insight that separates great revenue-share implementations from mediocre ones is this: the best platforms make the split feel irrelevant by making the total pie so large that both sides earn more than they could anywhere else. YouTube creators don't love giving up 45% of their ad revenue. But they stay because YouTube's recommendation engine, global audience, and monetization infrastructure generate more total revenue than any alternative. The split is the cost of access to the machine. When the machine works, nobody complains about the cost.
The most dangerous trend I see in revenue-share models is creeping extraction — platforms gradually increasing their effective take rate through new fees, mandatory services, and algorithmic changes that reduce organic visibility (forcing partners to pay for ads). Etsy has done this. Amazon has done this. The App Store has done this through its Search Ads product. Each individual change is defensible. In aggregate, they transform a partnership into a tollbooth. The platforms that will win the next decade are the ones disciplined enough to resist this temptation — or at least transparent enough to justify each incremental cost with incremental value.
One final observation: revenue share is increasingly becoming a regulatory battleground. The EU's Digital Markets Act, South Korea's Telecommunications Business Act, and ongoing antitrust actions in the U.S. are all targeting the splits that dominant platforms charge. Founders building revenue-share models today need to design them with the assumption that their terms will eventually be scrutinized by regulators — and that the defense "we built the platform, so we set the rules" will not be sufficient. The platforms that proactively offer fair, transparent, and adjustable splits will be the ones that avoid the courtroom.
Section 10
Top 5 Resources
01
Essay
The essential essay on platform pricing strategy. Gurley argues that most platforms set their revenue share too aggressively, inviting competition and regulatory scrutiny. His core thesis — that a lower take rate can produce a larger, more defensible business — is the single most important strategic insight for anyone designing a revenue-share model. Written in 2013 and more relevant than ever.
02
Book
The most rigorous academic treatment of platform economics, including detailed analysis of how revenue-share structures affect ecosystem growth, partner behavior, and competitive dynamics. Chapter 5 on monetization is particularly relevant — it formalizes the tradeoffs between charging for access, charging for transactions, and sharing revenue. Essential for anyone designing split structures.
03
Essay
Thompson's framework explains why platforms that aggregate demand (Google, Facebook, Netflix) have different revenue-share dynamics than platforms that aggregate supply (App Store, YouTube). The distinction matters enormously: demand aggregators can often avoid revenue sharing entirely, while supply aggregators must share to attract contributors. Understanding where your platform sits on this spectrum determines your entire economic model.
04
Book
Written before the App Store existed, this book nonetheless provides the theoretical foundation for understanding revenue-share economics in information goods. Shapiro and Varian's analysis of versioning, bundling, and network effects explains why digital platforms can sustain revenue-share models that would be impossible in physical goods. The chapter on lock-in is particularly prescient.
05
Book
Chen's book is primarily about network effects, but its treatment of how platforms attract and retain their supply side is directly applicable to revenue-share design. The chapters on Uber's driver economics and YouTube's creator incentives show how revenue-share structures interact with cold-start dynamics — and why getting the split right in the early stages is existential.
Why this matters next
mental modelsNetwork Effects
Revenue share applied the Network Effects mental model
mental modelsIncentives
Revenue share applied the Incentives mental model
mental modelsLeverage
Revenue share applied the Leverage mental model
mental modelsScale
Revenue share applied the Scale mental model
mental modelsQuality
Revenue share applied the Quality mental model
mental modelsAlgorithms
Revenue share applied the Algorithms mental model
Continue exploring


Free playbook
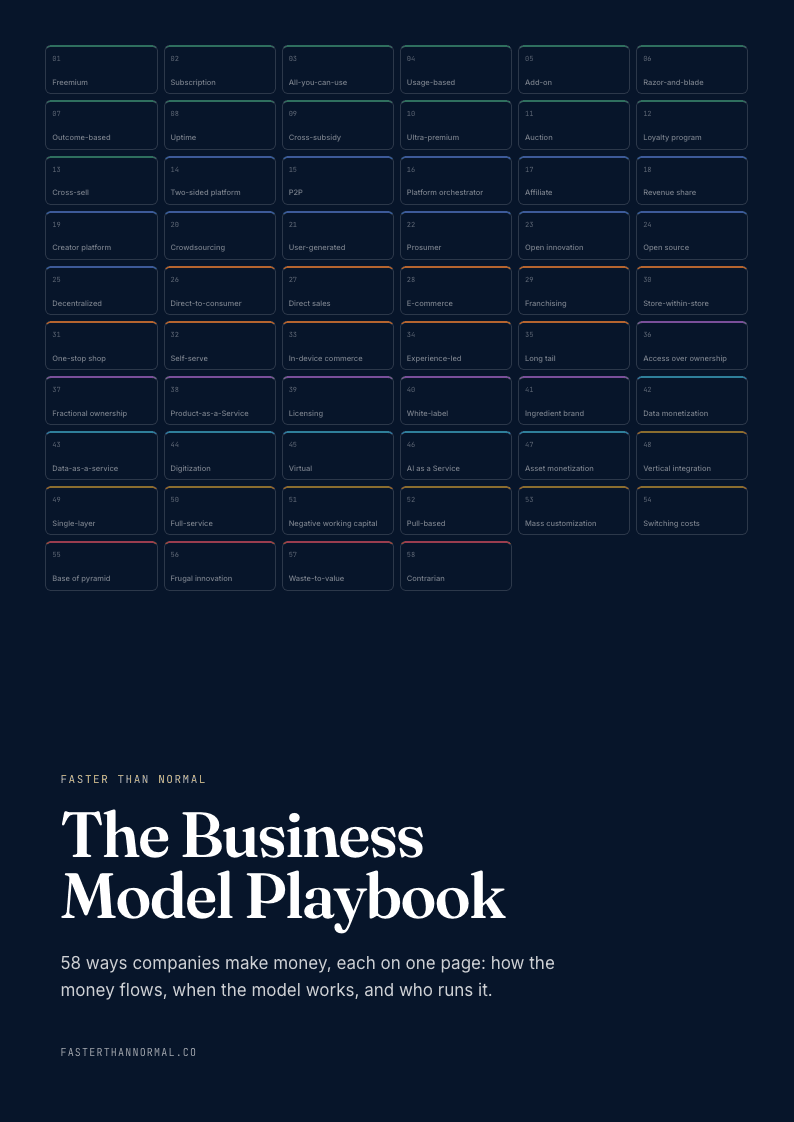
Get The Business Model Playbook
58 business models, one visual page each: how the money flows, the metrics that matter, and who runs it. Free when you join the Faster Than Normal email.
Free. No spam. Unsubscribe anytime.