
Contents
An enterprise revenue model built on contractual guarantees of system availability — typically expressed as "nines" (99.9%, 99.99%, 99.999%) — where the provider charges a significant premium for progressively higher uptime commitments and pays financial penalties (service credits) when those commitments are breached. The product is not the infrastructure itself; it is the elimination of risk.
Also called: Availability guarantee, Service-level commitment, Reliability-as-a-Service
Section 1
How It Works
The Uptime/Availability SLA model transforms a technical capability — keeping systems running — into a priced promise. The provider commits to a specific level of availability over a defined period (usually monthly or annually), and the customer pays a premium proportional to the stringency of that commitment. The higher the guaranteed uptime, the exponentially greater the engineering investment required — and the exponentially higher the price the provider can charge.
The critical insight is that each additional "nine" of availability is roughly ten times harder and more expensive to deliver than the last. Moving from 99% uptime (3.65 days of downtime per year) to 99.9% (8.76 hours) is a meaningful engineering challenge. Moving from 99.9% to 99.99% (52.6 minutes per year) requires redundant systems, automated failover, multi-region architecture, and 24/7 operations teams. Moving to 99.999% (5.26 minutes per year) demands near-military-grade infrastructure discipline. This exponential cost curve is what makes the pricing model work: the provider's costs increase linearly or sub-linearly through automation and scale, while the customer's willingness to pay increases exponentially as downtime becomes existentially threatening.
Monetization typically takes one of three forms. Tiered pricing is the most common: a base service at a standard availability level (say, 99.5%) with premium tiers at 99.9%, 99.99%, and above, each carrying a significant price uplift — often 30–100% per tier. Penalty-backed contracts formalize the commitment: if the provider misses the SLA, the customer receives service credits (typically 10–30% of the monthly bill for each percentage point of missed uptime). Hybrid models combine uptime guarantees with other performance metrics — latency, throughput, response time — into a composite SLA that commands an even higher premium.
ProviderInfrastructure OperatorRedundant systems, failover, monitoring, SRE teams
Guarantees→
SLA ContractAvailability Commitment99.9%–99.999% uptime, defined penalties, exclusions
Pays premium→
CustomerEnterprise BuyerMission-critical workloads, regulated industries, revenue-dependent systems
↑Premium of 30–200% over non-SLA pricing; service credits as penalty mechanism
The central tension in this model is asymmetric risk. The customer's cost of downtime — lost revenue, regulatory fines, reputational damage — is almost always orders of magnitude greater than the service credits the provider will pay. A 99.99% SLA from AWS might carry a 30% service credit for a breach, but the customer running a trading platform on that infrastructure could lose millions per minute of downtime. This asymmetry is a feature, not a bug: it's what allows providers to price the guarantee attractively while keeping their own risk manageable. But it also means the SLA is less an insurance policy and more a signal of engineering competence — a credible commitment that the provider has invested enough in reliability that breaches are genuinely rare.
Section 2
When It Makes Sense
The Uptime/Availability SLA model works when downtime has measurable, significant consequences for the customer — and when the provider can credibly deliver on the promise at a cost below what the customer is willing to pay for peace of mind.
✓
Conditions for SLA Premium Success
| Condition | Why it matters |
|---|---|
| Customer's cost of downtime is quantifiable and high | If a customer can calculate that one hour of downtime costs $500K in lost transactions, a $50K/year premium for an extra nine of availability is trivially justified. The model thrives where downtime has a clear dollar figure. |
| Regulatory or compliance requirements mandate uptime | Financial services (SEC, FCA), healthcare (HIPAA), and government contracts often require documented availability commitments. The SLA becomes a procurement checkbox, not a negotiation. |
| Provider has scale advantages in reliability engineering | Building redundant, multi-region infrastructure is enormously expensive. Hyperscalers like AWS, Azure, and Google Cloud can amortize this cost across millions of customers. A small provider offering the same SLA would go bankrupt on the first major outage. |
| Switching costs are high | When migrating away from a provider takes months and millions of dollars, the SLA premium is locked in. The customer can't easily punish a provider by leaving — which is why service credits exist as an intermediate remedy. |
| The service is deeply embedded in the customer's value chain | A CRM that goes down is annoying. A payment processing system that goes down stops revenue. The more mission-critical the service, the more the customer will pay for guaranteed availability. |
| Trust asymmetry exists | The customer cannot independently verify the provider's infrastructure quality. The SLA — backed by financial penalties — serves as a credible signal. Without it, the customer has no way to distinguish a reliable provider from a cheap one. |
| Multi-tenancy enables cost sharing | The provider serves thousands of customers on shared infrastructure, meaning the cost of redundancy is distributed. The marginal cost of offering an SLA to one more customer is near zero once the infrastructure is built. |
The underlying logic is an arbitrage: the provider invests once in reliability infrastructure and sells the resulting uptime guarantee thousands of times. The customer pays a fraction of what it would cost to build equivalent reliability in-house. Both sides win — as long as the provider actually delivers.
Section 3
When It Breaks Down
The SLA model's failure modes are subtle because they often don't manifest as obvious breakdowns — they manifest as slow erosion of trust, margin compression, or misaligned incentives.
⚠
Failure Modes
| Failure mode | What happens | Example |
|---|---|---|
| SLA theater | The provider offers impressive-sounding SLAs but buries exclusions (planned maintenance, "force majeure," partial outages) that render the guarantee nearly meaningless. Customers discover the SLA is marketing, not engineering. | Many cloud providers exclude "scheduled maintenance windows" from uptime calculations, effectively reducing a 99.99% SLA to 99.5% in practice. |
| Service credit inadequacy | The penalty for breach is a 10–30% service credit, but the customer's actual damages are 100–1000x that amount. The SLA provides no real financial protection, only a signal. | AWS's standard SLA offers a 30% credit for availability below 99.0% — cold comfort for a customer who lost $2M in revenue during the outage. |
| Correlated failure risk | When a hyperscaler has a major outage, it takes down thousands of customers simultaneously. The provider's service credit liability spikes, and the SLA model's economics invert. | The December 2021 AWS us-east-1 outage affected Netflix, Disney+, Slack, and thousands of others simultaneously. |
| Commoditization of nines | As cloud infrastructure matures, baseline availability improves across all providers. The premium for "extra nines" compresses because the standard offering is already good enough for most workloads. | AWS, Azure, and GCP all offer 99.99% SLAs on core compute services, making it hard for any one provider to differentiate on availability alone. |
| Moral hazard on the customer side | Customers with high SLAs under-invest in their own resilience (multi-region deployment, graceful degradation), assuming the provider's guarantee is sufficient. When the provider fails, the customer has no fallback. | Companies that run single-region on a 99.99% SLA and experience catastrophic failure when that region goes down. |
The most dangerous failure mode is SLA theater — not because it causes immediate harm, but because it systematically erodes the credibility of the entire model. When customers learn that SLAs are more about marketing positioning than engineering commitment, the willingness to pay a premium collapses. The providers who win long-term are the ones who treat SLA breaches as existential events, not accounting adjustments. IBM built its mainframe business on this principle for decades: the SLA wasn't a contract clause, it was a cultural commitment. When that culture weakens — when the operations team starts optimizing for "technically meeting the SLA" rather than "never going down" — the model begins to hollow out from the inside.
Section 4
Key Metrics & Unit Economics
The economics of the SLA model are driven by the gap between the cost of delivering reliability and the premium customers will pay for it. The key metrics track both sides of that equation.
Availability %
(Total minutes − Downtime minutes) ÷ Total minutes × 100
The headline metric. Measured monthly or annually. The difference between 99.9% and 99.99% is the difference between 8.76 hours and 52.6 minutes of annual downtime — but the engineering cost difference is 5–10x.
SLA Premium Uplift
(SLA tier price − Base price) ÷ Base price
The percentage price increase for each tier of availability guarantee. Healthy models see 30–100% uplift per additional nine. If the uplift is below 20%, the provider is under-pricing reliability.
Service Credit Exposure
Σ (Credit % × Monthly revenue) for all SLA-covered customers
The maximum financial liability if the provider misses SLAs across the entire customer base. Must be modeled against correlated failure scenarios, not just individual customer breaches.
Cost of Nines
Incremental infrastructure + ops cost per additional nine of availability
The marginal cost of moving from one availability tier to the next. Includes redundant hardware, multi-region replication, SRE headcount, automated failover systems, and testing infrastructure.
Mean Time to Recovery (MTTR)
Avg minutes from incident detection to service restoration
The operational metric that most directly determines whether SLAs are met. Best-in-class providers achieve MTTR under 5 minutes for automated failover scenarios. Manual recovery pushes MTTR to 30–120 minutes.
Incident Rate
Number of SLA-impacting incidents per month
Tracks the frequency of events that threaten the SLA. The goal is not zero incidents (impossible) but zero customer-impacting incidents through redundancy and automated recovery.
SLA Premium Revenue Formula
SLA Premium Revenue = Customers × Base Price × SLA Uplift %
Net SLA Margin = SLA Premium Revenue − Incremental Reliability Cost − Expected Service Credits
Expected Service Credits = P(breach) × Avg Credit % × Revenue at Risk
The key lever is the ratio between SLA premium revenue and the cost of delivering that reliability. At scale, this ratio improves dramatically because the infrastructure investment is largely fixed — adding one more customer to a multi-region, auto-failover architecture costs almost nothing incrementally. This is why hyperscalers dominate: their cost of nines is amortized across millions of customers, while their SLA premium revenue scales linearly with customer count. A provider with 100 customers paying $10K/month in SLA premiums and $5M in annual reliability infrastructure costs is barely breaking even. A provider with 100,000 customers paying the same premium on the same infrastructure is printing money.
Section 5
Competitive Dynamics
The competitive dynamics of the SLA model are shaped by a fundamental asymmetry: reliability is easy to promise and expensive to prove. Any provider can publish a 99.99% SLA on their website. Only a few can actually deliver it consistently — and even fewer can do so profitably.
This creates a natural oligopoly structure. The providers who can afford the infrastructure investment to genuinely deliver high availability — AWS, Azure, Google Cloud, IBM, Salesforce — capture the vast majority of mission-critical workloads. Smaller providers compete on price or specialization but struggle to match the reliability track record that enterprise buyers demand. The moat is not the SLA itself; it's the observable history of meeting it, which takes years to build and seconds to destroy.
Switching costs reinforce the oligopoly. An enterprise that has architected its systems around AWS's availability zones, used AWS-specific services, and trained its team on AWS tooling faces a migration cost measured in millions of dollars and months of engineering time. The SLA premium is a rounding error compared to the total cost of the relationship — which means the SLA functions less as a standalone revenue driver and more as a trust anchor that justifies the broader commercial relationship.
The most interesting competitive dynamic is the race to the bottom on standard SLAs paired with a race to the top on premium SLAs. As baseline cloud availability has improved (most major providers now offer 99.95%+ on core compute), the standard SLA has become table stakes — it no longer differentiates. The premium is now captured at the extremes: 99.999% availability for financial trading systems, healthcare platforms, and government infrastructure. These ultra-high-availability tiers require dedicated infrastructure, custom architectures, and white-glove support — and they command pricing that can be 3–5x the standard tier. This is where the real margin lives.
Section 6
Industry Variations
The SLA model manifests differently across industries because the cost of downtime, regulatory requirements, and competitive dynamics vary enormously.
◎
SLA Model Variations by Industry
| Industry | Typical SLA tier | Key dynamics |
|---|---|---|
| Cloud infrastructure (IaaS) | 99.95%–99.999% | The canonical SLA market. Tiered pricing across compute, storage, and networking. Service credits are the standard penalty. Differentiation increasingly comes from composite SLAs (availability + latency + durability). AWS S3 offers 99.999999999% (eleven nines) durability — a different but related promise. |
| Enterprise SaaS | 99.9%–99.99% | SLAs are table stakes for enterprise sales. Salesforce publishes real-time availability on trust.salesforce.com. The SLA is less about premium pricing and more about procurement qualification — without it, the deal doesn't close. Premium tiers often bundle priority support and dedicated infrastructure. |
| Financial services infrastructure | 99.999%+ | Regulated environments where downtime can trigger SEC/FCA penalties. SLAs often include latency guarantees (sub-millisecond for trading systems). Providers like IBM and specialized fintech infrastructure companies command extreme premiums. Custom penalty structures beyond standard service credits. |
| Telecommunications | 99.999% ("five nines") | The original SLA industry. "Five nines" was coined by telcos promising 5.26 minutes of annual downtime. Carrier-grade reliability remains the gold standard. Penalties are often regulatory (FCC fines) rather than contractual. The model is deeply embedded in how telecom infrastructure is priced and procured. |
| Logistics and supply chain | 95%–99.5% (on-time delivery) | SLAs measured in delivery performance rather than system uptime. UPS guarantees specific delivery windows and refunds shipping costs for misses. The "availability" is physical, not digital — but the economic logic is identical: promise reliability, charge a premium, pay penalties for failure. |
| Healthcare IT | 99.99%+ | HIPAA and patient safety requirements create non-negotiable uptime mandates. EHR systems (Epic, Cerner) must maintain near-continuous availability. Downtime can literally be life-threatening. SLA premiums are embedded in licensing fees rather than broken out separately, making the premium less visible but no less real. |
Section 7
Transition Patterns
The SLA model rarely exists in isolation — it's typically layered on top of another business model (subscription, usage-based, licensing) as a premium modifier. Understanding where it comes from and where it leads reveals the strategic logic.
Evolves fromSubscriptionUsage-based / Pay-as-you-goLicensing
→
Current modelUptime / Availability SLA
→
Evolves intoOutcome-based / Pay-for-performanceFull-service / Integrated solutionSwitching costs / Ecosystem lock-in
Coming from: Most SLA models begin as standard subscription or usage-based services that add availability guarantees as they move upmarket. AWS launched in 2006 with no formal SLAs; the first EC2 SLA (99.95%) arrived in 2008 as enterprise customers demanded contractual commitments before migrating production workloads. Salesforce followed a similar trajectory — the product came first, the SLA came when the customer base shifted from SMBs to Fortune 500 companies with procurement departments that required documented guarantees.
Going to: The natural evolution is toward outcome-based models where the provider guarantees not just uptime but business outcomes — transaction throughput, response time percentiles, data processing SLAs. This is already happening in the observability space, where companies like Datadog are moving from "we'll monitor your systems" to "we'll guarantee your systems meet performance targets." The further evolution is toward full-service integrated solutions where the provider takes end-to-end responsibility for a business function, with the SLA as the contractual backbone. IBM's managed services business exemplifies this: the SLA covers not just infrastructure availability but application performance, security posture, and compliance status.
Adjacent models: The SLA model naturally deepens ecosystem lock-in because the reliability guarantee is architecture-dependent. A customer who has designed their system for AWS's multi-AZ failover can't easily replicate that reliability on another provider without re-architecting. The SLA premium is the visible price; the switching cost is the invisible one.
Section 8
Company Examples
I
IBM
Mainframe availability · 99.999% uptime heritage · Premium licensing + managed services
IBM invented the modern SLA model with its mainframe business, where "five nines" became the gold standard for enterprise computing. IBM's System z mainframes reportedly achieve 99.999% availability through redundant processors, hot-swappable components, and self-healing firmware — capabilities that justified pricing 5–10x higher than commodity server alternatives. The genius was making reliability a brand identity: "Nobody ever got fired for buying IBM" was fundamentally an SLA value proposition. IBM's managed infrastructure services division (now Kyndryl, spun off in 2021) extended this model by guaranteeing availability across entire IT estates, not just individual machines.

Amazon
Tiered cloud SLAs · 99.95%–99.999% across services · Service credits as penalty
AWS operationalized the SLA model at unprecedented scale. Each service carries its own SLA — EC2 at 99.99% for multi-AZ deployments, S3 at 99.9% availability (with eleven nines of durability), RDS at 99.95%. The pricing architecture is elegant: the base service is competitively priced, but achieving the highest availability tiers requires multi-AZ or multi-region deployment, which doubles or triples the infrastructure spend. AWS doesn't charge explicitly for the SLA — it charges for the architecture required to meet it. This makes the premium feel like a technical choice rather than a pricing tier, which reduces procurement friction.
MA
Microsoft Azure
Enterprise cloud SLAs · 99.95%–99.999% · Composite SLAs across service chains
Azure's distinctive contribution to the SLA model is the composite SLA — the recognition that enterprise applications span multiple services, and the end-to-end availability is the product of individual service availabilities. If your app uses Azure VMs (99.99%) and Azure SQL (99.99%), your composite SLA is 99.98%. Microsoft publishes detailed guidance on calculating composite SLAs and designing architectures to meet specific targets. This transparency — combined with Azure's deep integration with enterprise Microsoft products — makes the SLA a natural extension of existing enterprise relationships. Azure's premium SLA tiers for mission-critical workloads reportedly command 40–80% price premiums over standard configurations.
S
Salesforce
CRM platform · 99.9%+ availability · Real-time trust dashboard · Enterprise SLA tiers
Salesforce pioneered SLA transparency in the SaaS world with trust.salesforce.com, a real-time dashboard showing system status, performance, and historical availability across all instances. This radical transparency turned the SLA from a contract clause into a marketing asset. Salesforce's approach is instructive: rather than competing on the highest possible nines, they compete on visibility and accountability. Their standard SLA is 99.9%, but their actual delivered availability typically exceeds 99.99%. The gap between the contractual commitment and the delivered performance is deliberate — it provides a buffer against service credits while building trust through consistent over-delivery.
U
UPS
Logistics SLA · Guaranteed delivery windows · Money-back guarantee for service failures
UPS demonstrates that the SLA model extends far beyond digital infrastructure. UPS's Service Guarantee promises delivery by a specific time for premium services (Next Day Air, 2nd Day Air) and refunds the shipping cost if the deadline is missed. This is a pure availability SLA applied to physical logistics — the "uptime" is on-time delivery, and the "service credit" is a full refund. The premium is substantial: UPS Next Day Air can cost 5–10x standard ground shipping. The model works because UPS has invested billions in sorting facilities, aircraft, route optimization algorithms, and real-time tracking infrastructure — the physical equivalent of multi-region redundancy.
Section 9
Analyst's Take
Faster Than Normal — Editorial View
Here's the uncomfortable truth about the Uptime/Availability SLA model: most SLAs are not insurance policies. They are marketing documents.
The service credits offered by major cloud providers — typically 10–30% of the monthly bill — are economically trivial compared to the actual cost of downtime for the customer. A company running a $50K/month AWS bill that experiences a four-hour outage might receive $15K in service credits. If that company is an e-commerce platform doing $500K/hour in GMV, the actual loss is $2M. The SLA "penalty" covers less than 1% of the damage.
And yet, the model works. It works because the SLA is not really about the penalty. It's about the signal. When AWS publishes a 99.99% SLA for multi-AZ EC2 deployments, they're not primarily offering financial protection. They're making a credible commitment that they've invested the engineering resources to deliver that level of reliability. The SLA is a costly signal in the game-theoretic sense — it's expensive to offer (because breaches trigger credits and reputational damage), which makes it credible.
The founders and operators I see misunderstanding this model fall into two camps. The first camp over-indexes on the nines — they chase 99.999% availability when their customers would be perfectly happy with 99.9% and a fast recovery process. The incremental cost of that last nine can be 10x the revenue it generates. The second camp under-invests in the operational culture required to sustain high availability. They build redundant infrastructure but don't build the incident response processes, the chaos engineering practice, the blameless postmortem culture, or the SRE team needed to keep it running. Infrastructure is necessary but not sufficient.
The real competitive advantage in the SLA model is not the number of nines you promise — it's the speed and transparency with which you respond when things go wrong. Every provider will eventually have an outage. The ones that communicate proactively, resolve quickly, and publish honest postmortems build more trust than the ones that quietly issue service credits and hope nobody notices. Cloudflare's public incident reports have become a model for this approach — they turn failures into trust-building moments.
If I were building a business around the SLA model today, I would focus less on promising the highest possible uptime and more on building the observability, communication, and recovery infrastructure that makes customers feel safe even when things break. Peace of mind is the product. The nines are just the packaging.
Section 10
Top 5 Resources
01
Book
The definitive text on how Google builds and operates reliable systems at scale. Chapters on SLOs, SLIs, and error budgets provide the engineering framework that underpins every credible SLA. Free to read online. If you're building or buying SLA-backed services, this is required reading.
02
Book
Written by two former Amazon VPs, this book reveals how AWS's operational culture — including its approach to availability, incident management, and customer trust — was built from the inside. The sections on operational excellence explain why AWS can credibly offer SLAs that smaller providers cannot.
03
Book
Stone's account of Amazon's evolution includes critical context on how AWS transformed infrastructure reliability from a cost center into a revenue model. The chapters on AWS's origins reveal how internal uptime demands for Amazon's retail business became the foundation for the world's largest cloud SLA business.
04
Book
Porter's framework for understanding how companies create sustainable competitive advantage through their value chain is essential for understanding why the SLA model creates lock-in. The concept of "differentiation through reliability" — where operational excellence becomes a strategic moat — is the theoretical foundation of the entire model.
05
Book
Slywotzky's analysis of how value migrates across industries explains why the SLA model captures disproportionate profit. His concept of "profit models" — the specific mechanisms by which companies extract value — illuminates why guaranteeing availability commands premiums that far exceed the incremental cost of delivery.
Why this matters next
mental modelsIncentives
Uptime / Availability SLA applied the Incentives mental model
mental modelsScale
Uptime / Availability SLA applied the Scale mental model
mental modelsBuffer
Uptime / Availability SLA applied the Buffer mental model
mental modelsQuality
Uptime / Availability SLA applied the Quality mental model
mental modelsEnvironment
Uptime / Availability SLA applied the Environment mental model
mental modelsTiered Pricing
Uptime / Availability SLA applied the Tiered Pricing mental model
Continue exploring


Free playbook
Get The Business Model Playbook
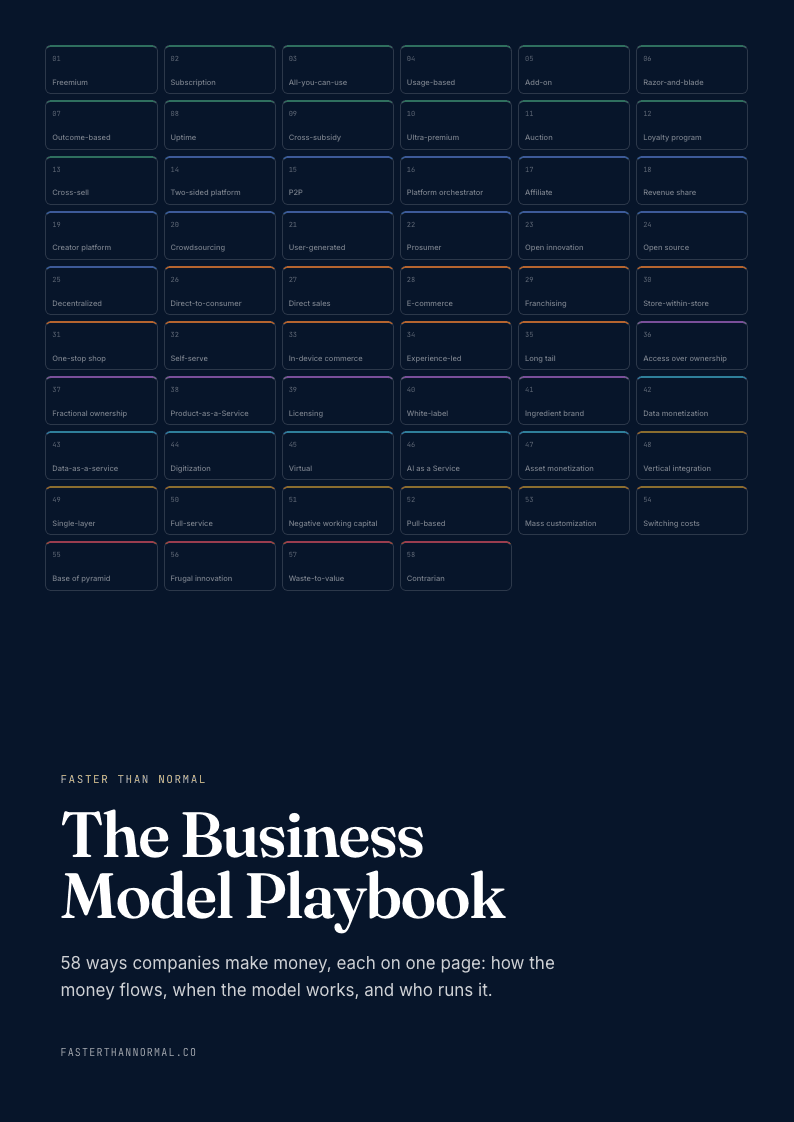
58 business models, one visual page each: how the money flows, the metrics that matter, and who runs it. Free when you join the Faster Than Normal email.
Free. No spam. Unsubscribe anytime.